Watchlist For Week Starting 11/8/21
- Nov 7, 2021
- 4 min read
$TSLA intraday: as long as 1194.2 is support look for 1297
Our pivot point stands at 1194.2.
Long: As long as 1194.2 is support look for 1297.
Short: The downside breakout of 1194.2 would call for 1157.2 and 1135.2. Comment: The RSI is above 50. The MACD is below its signal line and positive. Prices could retrace in the short term. Tesla is trading under its 20 period moving average (1230.51) but above its 50 period moving average (1205.35).

$AMZN intraday: as long as 3475 is support look for 3619.75
Our pivot point stands at 3475.
Long: As long as 3475 is support look for 3619.75.
Short: The downside breakout of 3475 would call for 3434.25 and 3410.
Comment: The RSI is above 50. The MACD is positive and below its signal line. Prices could retrace in the short term. Amazon.com is below its 20 period moving average (3516.23) but above its 50 period moving average (3417.42)

$AAPL intraday: the downside prevails as long as 151.6 is resistance
Our pivot point stands at 151.6.
Short: The downside prevails as long as 151.6 is resistance.
Long: The upside breakout of 151.6, would call for 152.8 and 153.6.
Comment: The RSI is below its neutrality area at 50. The MACD is below its signal line and negative. The configuration is negative. Apple stands below its 20 and 50 period moving average (respectively at 150.98 and 150.93).

$NFLX intraday: the RSI is oversold
Our pivot point is at 653.8.
Short: The downside prevails as long as 653.8 is resistance.
Long: The upside breakout of 653.8, would call for 661.2 and 665.6.
Comment: The RSI is trading below 30. This could mean that either prices are in a lasting downtrend or just oversold and that therefore a rebound could shape (look for bullish divergence in this case). The MACD is negative and below its signal line. The configuration is negative. NetFlix is trading under both its 20 and 50 period moving average (respectively at 659.14 and 671.72).

$FB intraday: as long as 337.2 is support look for 350.2
Our pivot point stands at 337.2.
Long: As long as 337.2 is support look for 350.2.
Short: Below 337.2, expect 332.8 and 330.
Comment: The RSI is above 50. The MACD is positive and below its signal line. Prices could retrace in the short term. Facebook is above its 20 and 50 period moving average (respectively at 339.55 and 333.62).

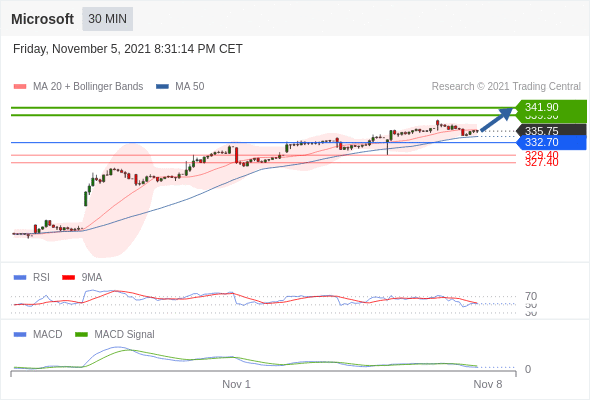
$MSFT intraday: as long as 332.7 is support look for 341.9
Our pivot point is at 332.7.
Long: As long as 332.7 is support look for 341.9.
Short: The downside breakout of 332.7 would call for 329.4 and 327.4.
Comment: The RSI is above its neutrality area at 50. The MACD is positive and below its signal line. Prices could retrace in the short term. Microsoft is below its 20 period moving average (336.11) but above its 50 period moving average (334.32).

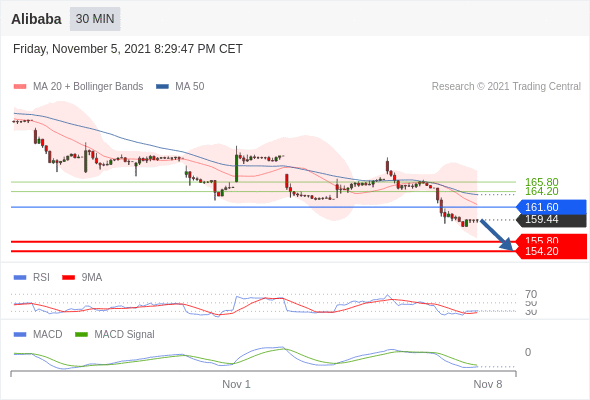
$BABA intraday: the downside prevails as long as 161.6 is resistance
Our pivot point is at 161.6
Short: The downside prevails as long as 161.6 is resistance.
Long: Above 161.6, look for 164.2 and 165.8.
Comment: The RSI is below its neutrality area at 50. The MACD is negative and below its signal line. The configuration is negative. Alibaba stands below its 20 and 50 period moving average (respectively at 162.03 and 163.68).

$GOOGL intraday: as long as 2937.75 is support look for 3057
2937.75 is our pivot point.
Long: As long as 2937.75 is support look for 3057.
Short: Below 2937.75, expect 2896 and 2871.
Comment: The RSI is above its neutrality area at 50. The MACD is positive and below its signal line. Prices could retrace in the short term. Alphabet is below its 20 period moving average (2981.03) but above its 50 period moving average (2944.71).

***The Content is for informational purposes only, you should not construe any such information or other material as legal, tax, investment, financial, or other advice. Nothing contained on our Site constitutes a solicitation, recommendation, endorsement, or offer by UpRise Traders or any third party service provider to buy or sell any securities or other financial instruments in this or in in any other jurisdiction in which such solicitation or offer would be unlawful under the securities laws of such jurisdiction.
All Content on this site is information of a general nature and does not address the circumstances of any particular individual or entity. Nothing in the Site constitutes professional and/or financial advice, nor does any information on the Site constitute a comprehensive or complete statement of the matters discussed or the law relating thereto. UpRise Traders is not a fiduciary by virtue of any person’s use of or access to the Site or Content. You alone assume the sole responsibility of evaluating the merits and risks associated with the use of any information or other Content on the Site before making any decisions based on such information or other Content. In exchange for using the Site, you agree not to hold UpRise Traders, its affiliates or any third party service provider liable for any possible claim for damages arising from any decision you make based on information or other Content made available to you through the Site.***


Comments